
A Few Ångströms of Pt–Pt Spacing Decide Phosphorescent OLED Roll-off
Phosphorescent OLEDs lose efficiency as they get brighter. Researchers at the University of Queensland and Kyushu University narrowed down the cause with two platinum complexes built on the same core. The one whose Pt atoms sit just over 3 Å apart kept about 65% of its peak efficiency even at 10,000 cd/m², while the one with Pt atoms more than 5 Å apart fell to a tenth at 1,000 cd/m². But the very structure that tamed roll-off pulled the emission colour down to red.
DOI 10.1002/advs.77325Phosphorescent OLEDs have one long-standing weakness. The brighter you drive them, the lower their efficiency. This is called efficiency roll-off.
At modestly bright settings it barely shows. The trouble is places that have to be very bright: a screen under sunlight, or augmented reality glasses that lay images over the real world right in front of the eye.
A joint team from the University of Queensland and Kyushu University narrowed down the cause of this roll-off using two platinum complexes with an identical core that differ only in their side groups. One OLED kept about 65% of its peak efficiency even at 10,000 cd/m². The other dropped to 1/10 of its efficiency at 1,000 cd/m².
What separated the two was the distance between platinum atoms on neighbouring molecules. On one side it was a little over 3 ångströms, on the other more than 5 ångströms. One ångström is a hundred-millionth of a centimetre (1/100,000,000 cm).
And what this article wants to point to comes after that. The very structure that tamed roll-off pulled the emission colour down to red.
1. Why phosphorescent OLEDs lose efficiency as they get brighter
Because the excited states of phosphorescent emitters live a long time. Of the excited states (excitons) created by current, 75% are triplets, and phosphorescent materials turn these into light as well, approaching 100% internal quantum efficiency. The price is that triplets are long-lived.
Long-lived excitons have many chances to collide with each other before they emit. Raise the current to raise brightness and the excitons crowd together, and triplet-triplet annihilation, in which two triplets meet and one vanishes without light, becomes frequent. That is roll-off.
The paper’s introduction puts the brightness needed for commercial TVs at about 500 cd/m², and sets 10,000 cd/m² as the brightness at which next-generation emitters should hold close to 100% efficiency. It writes that what governs both conditions is the density and lifetime of excitons inside the device.
So the prescription is clear. High emission efficiency, short excited-state lifetime. A candidate that has both, and that has drawn attention recently, is the platinum complex that emits by metal-metal-to-ligand charge transfer (MMLCT).
2. Two platinum complexes that differ only in their side groups
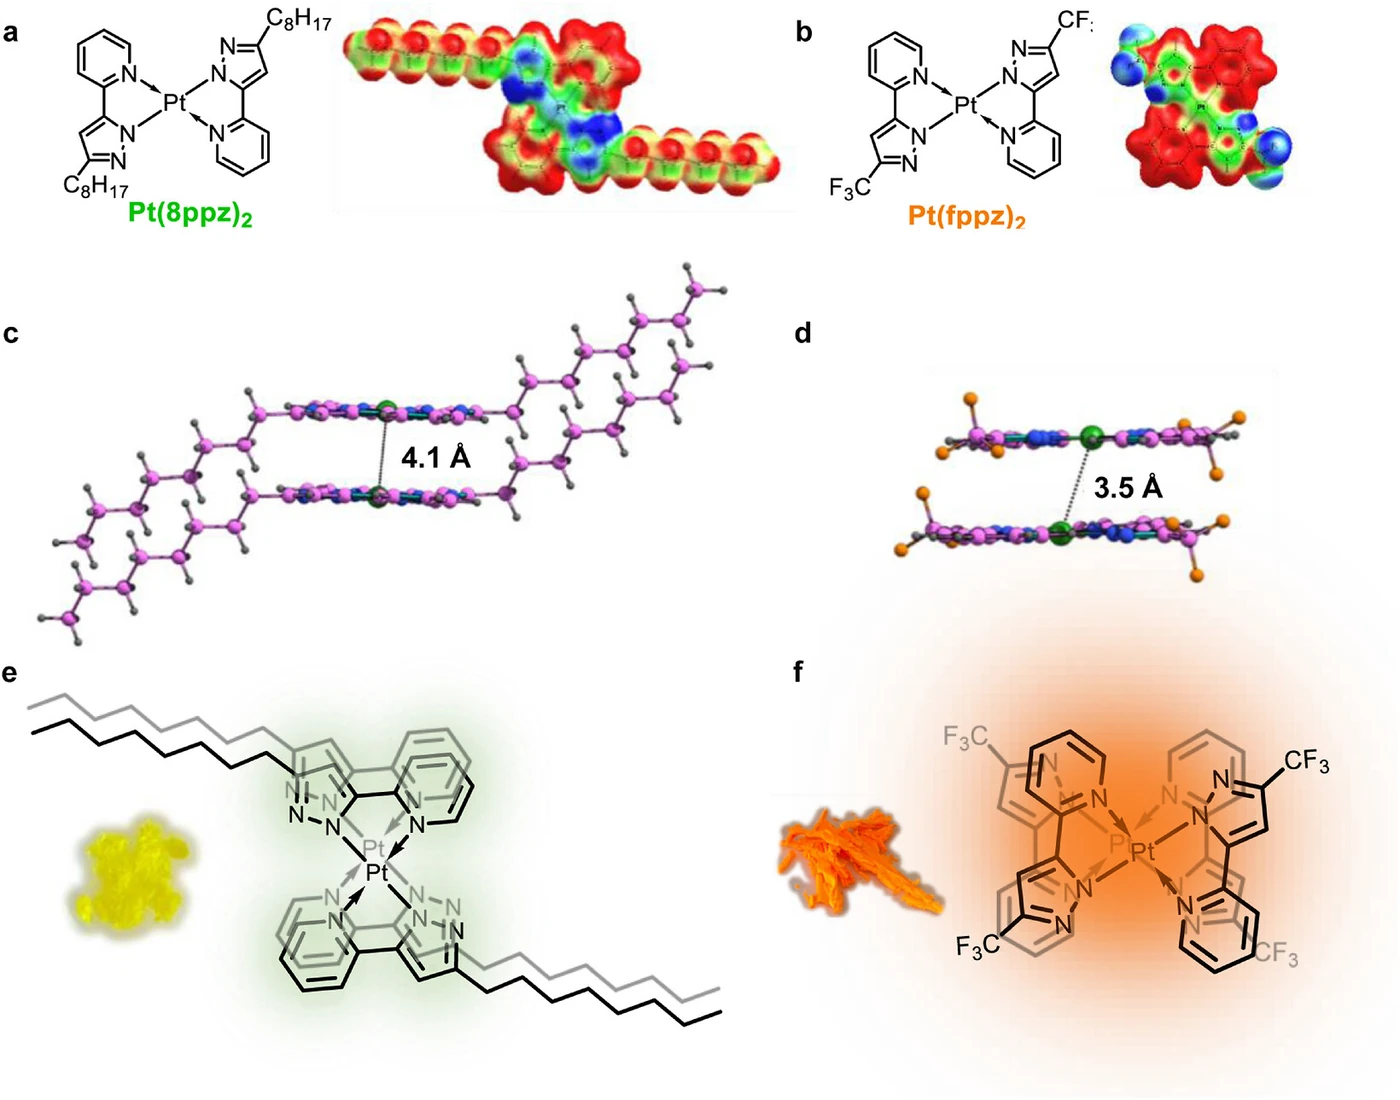
What the team set out to do was change just one thing, the distance between platinum atoms. MMLCT arises when flat platinum complexes stack layer upon layer so that the orbitals of neighbouring platinum atoms overlap. For that, the platinum atoms have to be close.
Yet data that properly measured that distance were scarce. Until now it was confirmed by single-crystal X-ray structures, but the evaporated films used in OLEDs are not single crystals. The paper writes that single-crystal analysis cannot tell you the platinum spacing inside a semi-crystalline film.
The team took the well-known MMLCT emitter Pt(fppz)2 as the reference. Its side groups carry small, electron-withdrawing trifluoromethyl groups (CF3).
The comparison is the newly made Pt(8ppz)2. The core with platinum at its centre is the same; only the side groups were changed to long carbon chains (n-octyl). The design has the long chains interlock like a zip, so that the molecules stack offset from one another and the platinum spacing widens.
3. Platinum spacing measured with synchrotron X-rays
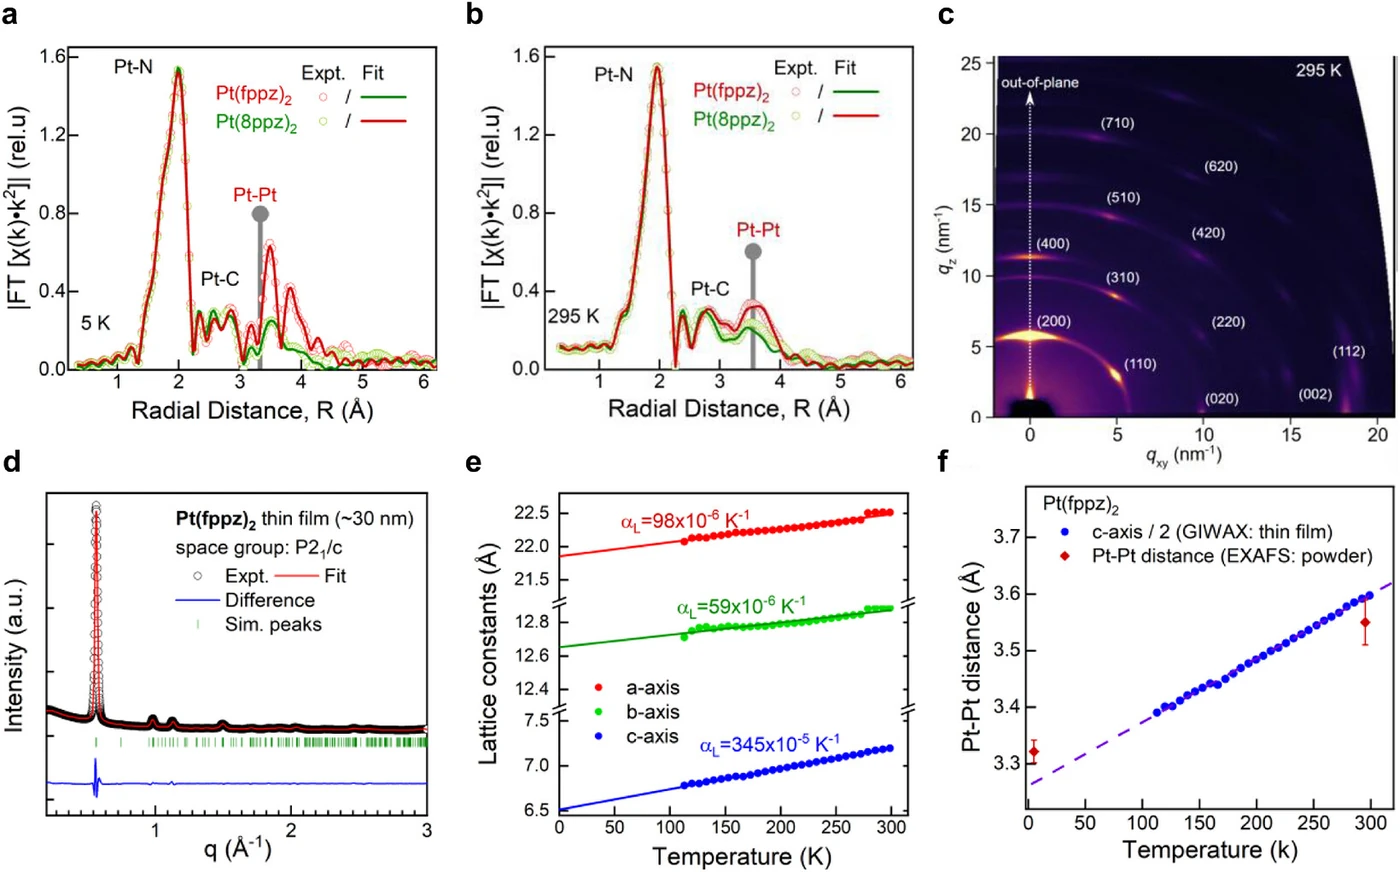
The team measured the platinum spacing with two synchrotron X-ray techniques. One is extended X-ray absorption fine structure (EXAFS), which sees neighbour distances right around the platinum atom; the other is grazing-incidence wide-angle X-ray scattering (GIWAXS), which sees the crystalline order of the film as a whole.
In EXAFS, a separate signal from a neighbouring platinum appeared only for Pt(fppz)2. The platinum spacing fitted with a model at −268 °C (5K) was 3.32Å. For Pt(8ppz)2 this signal did not appear, because the spacing exceeds 5.5Å and lies beyond the range this measurement can detect.
EXAFS also tells you how many molecules are stacked in a row. Pt(fppz)2 had on average 4 to 10 molecules neatly stacked at 5K, dropping to 2 to 4 molecules at room temperature (295K). In other words, stacks get shorter as temperature rises.
The films also differed sharply. The evaporated Pt(fppz)2 film was a crystal well aligned in one direction, while the Pt(8ppz)2 film was mostly amorphous. The long chains disrupted crystalline order itself.
4. Twice the emission efficiency, four times the emission rate
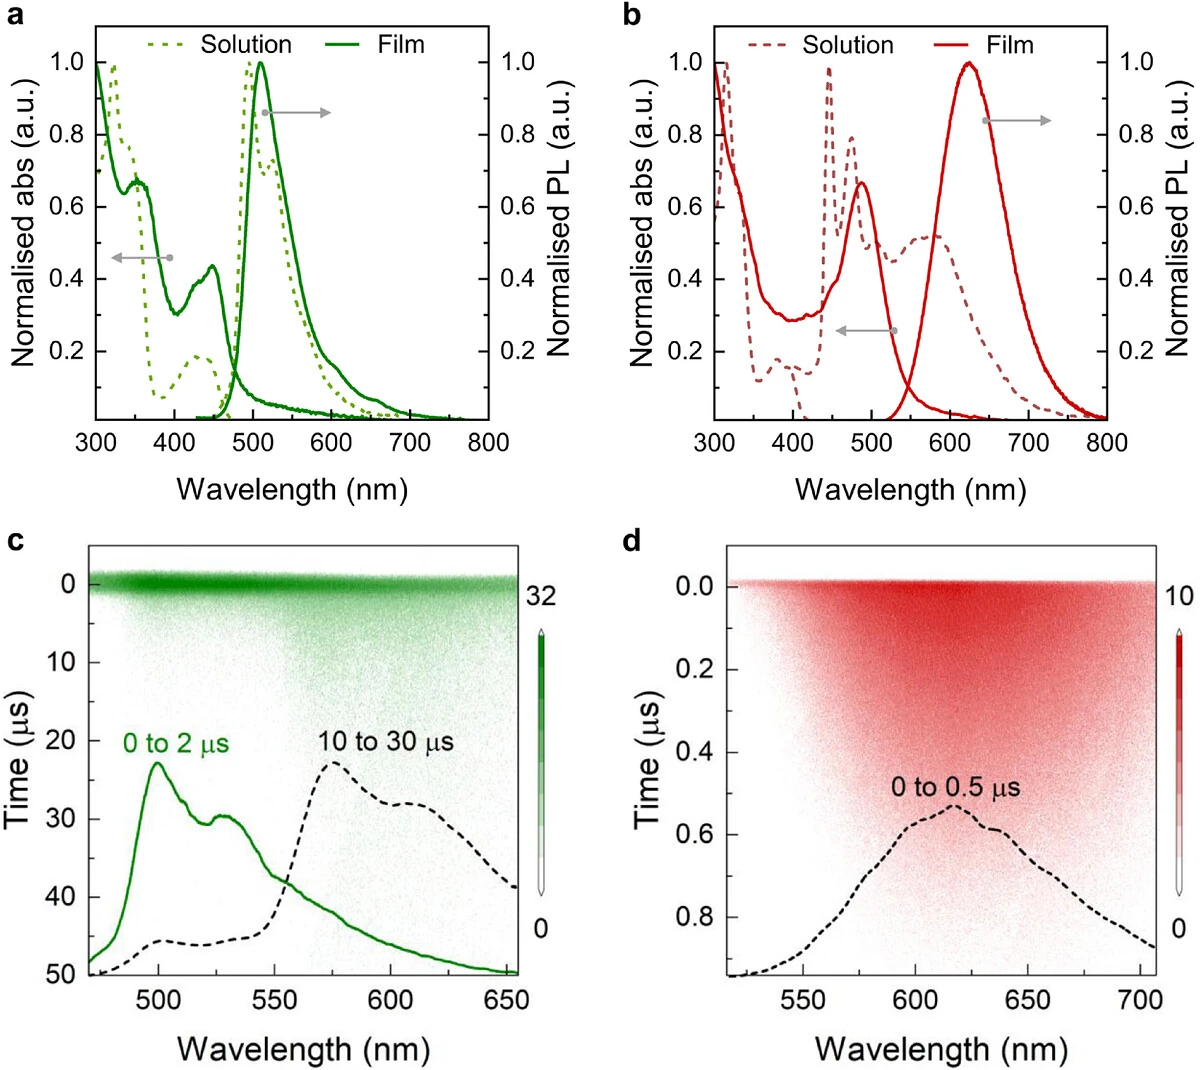
The complex with widely spaced platinum and the one with closely spaced platinum differed twofold in emission efficiency and fourfold in emission rate. In evaporated films, the photoluminescence quantum yield (PLQY) of Pt(fppz)2 was 93% and that of Pt(8ppz)2 44%.
The larger difference is the excited-state lifetime. The Pt(fppz)2 film decayed in a single step in 370 nanoseconds. The Pt(8ppz)2 film decayed with two components, 0.70 microseconds and 8.6 microseconds. Comparing the long component alone, that is about 23 times.
| Film | PLQY | Emission wavelength | Lifetime | Radiative rate |
|---|---|---|---|---|
| Pt(8ppz)2 | 44% | 509nm | 0.70·8.6µs | 6.31×10⁵/s |
| Pt(fppz)2 | 93% | 624nm | 0.37µs | 25.3×10⁵/s |
The light the two molecules emit was also different in nature. In time-resolved emission spectra, Pt(8ppz)2 began with ligand-centred emission near 520nm and shifted over about one microsecond to excimer emission near 600nm. This is light that comes out late from an excited state in which two molecules have clumped together.
Pt(fppz)2 emitted broad 620nm light as soon as it was excited, and the spectral shape stayed almost the same to the end. That means it did not pass through any other state along the way.
5. The evidence that platinum atoms bond was written in a vibration
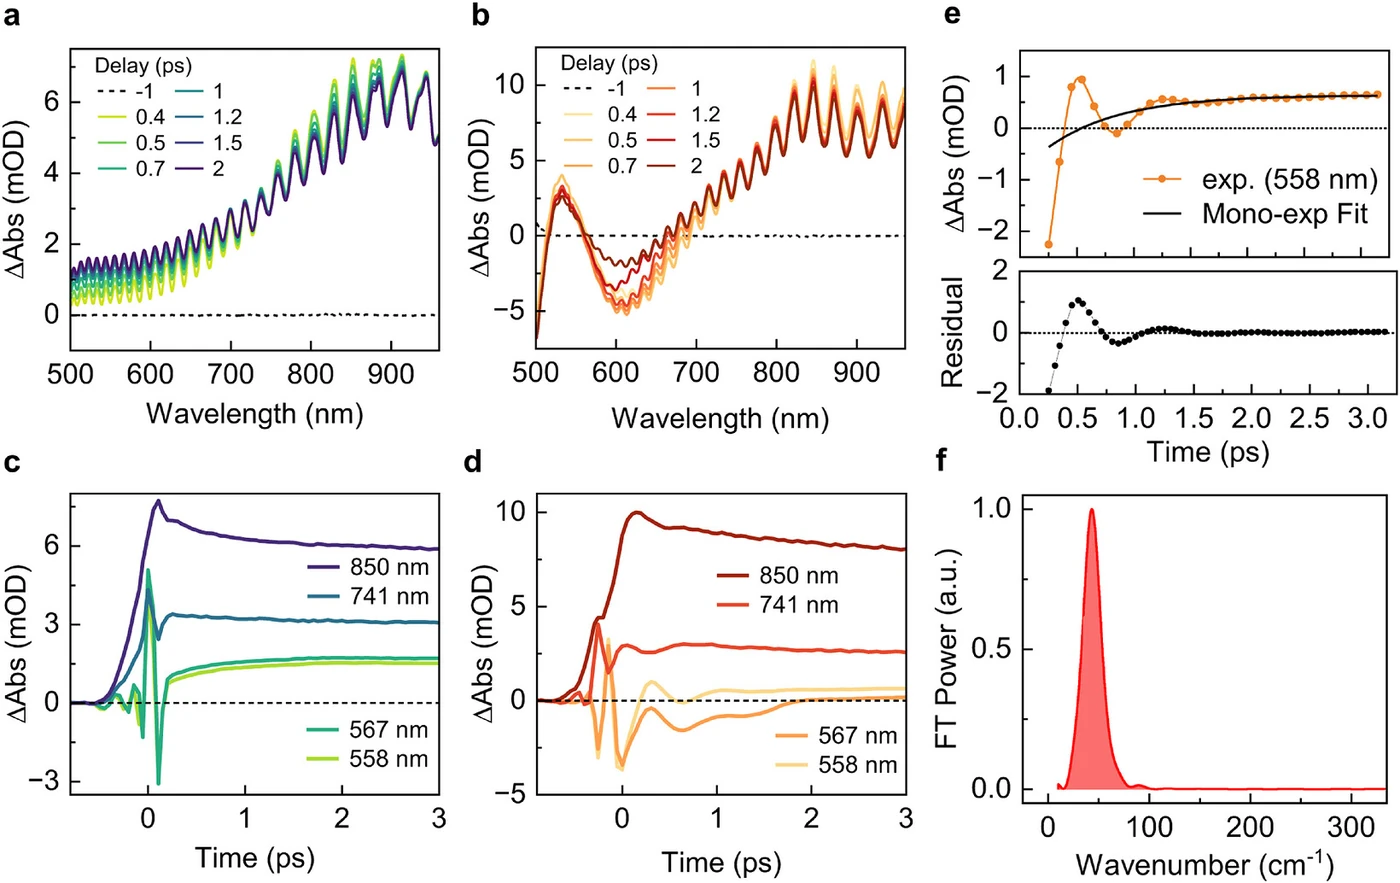
As direct evidence that MMLCT had formed, the team put forward a vibration in which two platinum atoms pull toward and push away from each other. The Kyushu University side captured it with femtosecond transient absorption spectroscopy. One femtosecond is a thousandth of a trillionth of a second (1/1,000 trillion).
On the signal of the Pt(fppz)2 film, a ripple-like oscillation was superimposed for about 1.5 picoseconds right after excitation. The team subtracted the exponential decay from the 558nm signal and converted the remaining oscillation to frequency. A single clear peak appeared at 45cm-1.
The paper interprets this low frequency as a platinum-platinum stretching vibration. It is a vibration between heavy atoms, nearly thirty times slower than the vibration of the ligand ring (about 1,280cm-1). The Pt(8ppz)2 signal showed no such oscillation. The team presents this as evidence that an excited state with bonded platinum atoms formed only in Pt(fppz)2.
6. How different was roll-off in the OLEDs
The Pt(fppz)2 OLED kept about 65% of its peak external quantum efficiency (EQE) at 10,000 cd/m², while the Pt(8ppz)2 OLED fell to 1/10 of its peak at 1,000 cd/m². It is a comparison in the same device structure with only the emitting layer changed.
The device was simple: a three-layer structure of 35nm TAPC hole transport layer, 25nm emitting layer, 60nm TmPyPB electron transport layer and LiF/Al electrode stacked on an ITO electrode. The emitting layer was the complex alone, evaporated neat without a host.
Peak EQE was 29% for Pt(fppz)2 and 9% for Pt(8ppz)2. Pt(fppz)2 was still at 23% at 5,000 cd/m². Emission wavelengths were 623nm and 513nm respectively, nearly overlapping the photoluminescence.
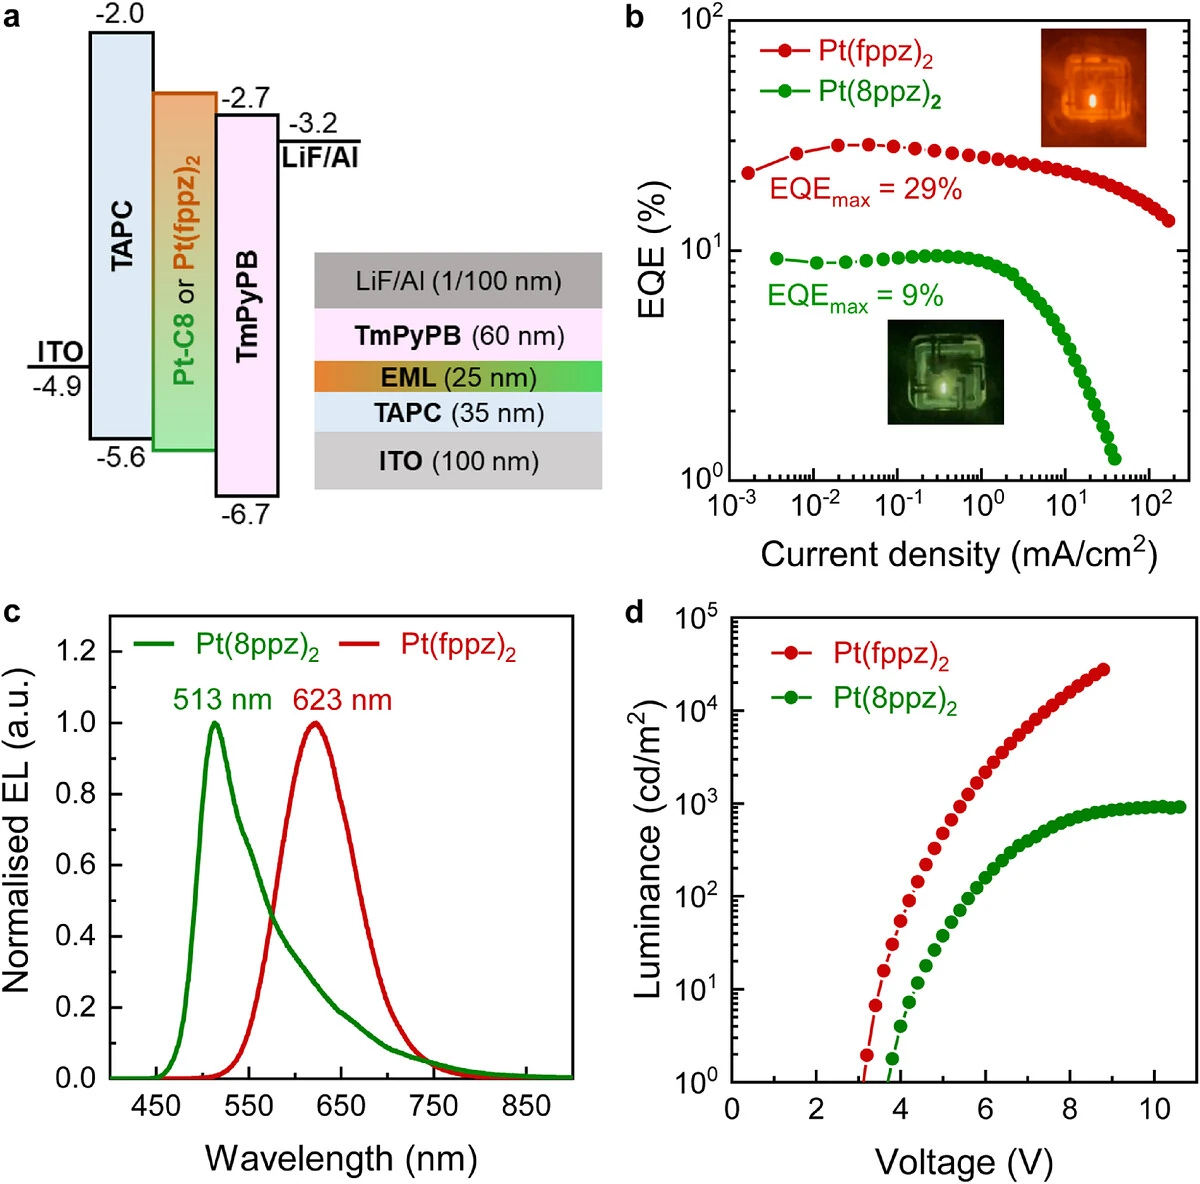
The team also pushed to the limit with short pulses. Applying voltage pulses 10 microseconds wide to reduce Joule heating, the Pt(fppz)2 OLED produced a brightness close to 105 cd/m² at currents above 1A/cm². EQE stayed above 10% at 35,000 cd/m² and above 5% at 80,000 cd/m².
What the paper names as the cause of the roll-off difference is the short lifetime of the MMLCT state. The electroluminescence decay measured in the devices was also much faster for Pt(fppz)2. If excitons leave quickly as light, they do not pile up enough to collide even when current rises.
In hole-only devices, the hole mobility of Pt(fppz)2 was about three times higher. The interpretation is that in a densely stacked crystalline film, charge hops readily between molecules.
7. Why the structure that tames roll-off turns the emission red
Because the MMLCT state formed by overlapping orbitals of platinum atoms is inherently low in energy. The cause that tamed roll-off and the cause that made it red are not separate; they are one and the same. This is the first fact to grasp when reading this paper from the industry side.
The paper’s table shows it. In solution, where the molecules are dispersed, Pt(fppz)2 emitted very weakly in the blue region at 447nm (PLQY below 1%). But in the film where the molecules stack, it moved all the way to 624nm, a shift of 177nm. Pt(8ppz)2, whose platinum atoms do not come together, moved only 14nm, from 495nm in solution to 509nm in film.
The paper’s introduction records this too. It writes that MMLCT complexes have shorter lifetimes and lower emission energies than conventional charge-transfer complexes, and that neat-film MMLCT OLEDs have shown outstanding performance particularly in the red to near-infrared region.
So the problem this work directly solves is roll-off in the red and near-infrared. This paper offers no route for carrying the same principle straight over to blue phosphorescence, where roll-off is most troublesome. Even a molecule that emitted in the blue region when dispersed turned red the moment it stacked.
8. Between the abstract and the body
There are five things to separate when reading this paper, all of which are missed if you look only at the abstract and figures.
First, the abstract’s “3.3Å” is a value measured at −268 °C. The abstract gives the platinum spacing of Pt(fppz)2 as “about 3.3Å”. This is the EXAFS value of 3.32Å from a powder sample at 5K. Figure 2f shows that at room temperature it is about 3.55Å by EXAFS and about 3.6Å by film GIWAXS. The spacing at the temperature where an OLED actually operates is the latter.
Second, the thermal expansion figures that govern platinum spacing do not agree between the text and the figure. The text gives the c-axis thermal expansion coefficient as “about 35×10-6/K” and states that it is larger than for the a and b axes. Yet the a axis in the same figure is 98×10-6/K. If 35 were right, the c axis would actually be smaller.
The c-axis data in Figure 2e grow from about 6.78Å to 7.19Å between 110K and 300K. Taken as a slope, that is on the order of 10-4/K, about ten times larger than the number in the text. It also differs in order of magnitude from the figure label (345×10-5).
The lattice constants are off as well. The a 22.05Å, b 12.72Å and c 6.75Å that the text gives as “room-temperature” values match the values near 110K in Figure 2e.
Whichever number you take, the direction is the same. The direction in which platinum stacks expands unusually readily. The paper also writes that this is why the neighbouring-platinum signal weakens at room temperature.
But there are no data measuring efficiency and colour while raising device temperature. Given that devices heat up the brighter they are driven, that is an empty column.
Third, the light outcoupling efficiencies of 31% and 20% were not measured separately. The paper explains the peak EQE difference through charge balance, high PLQY and efficient outcoupling. But 29% divided by 93% is 31%, and 9% divided by 44% is 20%. For the 20%, the paper itself writes that it was estimated assuming a PLQY of 44%.
Both values are the same as a calculation that sets charge balance at 100%. So these numbers cannot tell whether charge balance or outcoupling created the efficiency difference.
Fourth, the two molecules differ in several things at once besides platinum spacing. Emission colour (red versus green), film state (crystalline versus amorphous) and hole mobility (about threefold) all differ. The electroluminescence decay measurement supports the lifetime difference, but how much of the roll-off is due to lifetime and how much to charge transport was not separated.
Fifth, the applications the abstract cites and the “operational stability” the conclusion mentions were not tested in this paper. The abstract names visible light communication, bioimaging and transparent displays as applications, but there are no such experiments.
The conclusion closes on a design strategy for “materials with improved brightness and operational stability”, yet the body contains no data measuring device lifetime. The 80,000 cd/m² also comes from 10-microsecond pulsed drive.
9. What remains for industry
Even so, there is something this work clearly showed.
That roll-off can be explained by the way a material “stacks”. Changing only the side groups on the same core decided whether the film became crystalline or amorphous. That carried through the platinum spacing and the lifetime all the way to the device’s roll-off.
The team strung this chain together with X-rays, ultrafast spectroscopy and device measurements.
The simplicity of the device structure is also worth noting. A peak EQE of 29% came from a three-layer device with a single emitting material evaporated on its own, without co-evaporating a dopant into a host. However, how uniform the crystalline film is over a large area, and how it behaves in pixel-level processing, are not addressed by this paper.
The 3.3Å, the 29% and the 100,000 cd/m² are all numbers with conditions attached. A spacing at 5K, an efficiency at its peak, a brightness under pulsed drive. There is one thing this paper showed without conditions. The structure that empties excited states quickly tamed roll-off, and that very structure fixed the colour at red. The first speaks to a possibility; the second tells you in which colour that possibility opens first.