How Curing Phase Tunes LC-Gel Temperature Sensors
Liquid crystals are highly sensitive to temperature — a property displays have spent decades trying to erase. An Italian team turned that sensitivity into a signal, building a capacitive sensor with a liquid-crystal gel dielectric fabricated on ordinary LC panel-line equipment, one that kept working submerged in water and bent. What set sensitivity apart wasn't how much liquid crystal was loaded, but the phase it was in when cured.
DOI 10.1021/acsami.6c12680Liquid crystals are sensitive to temperature. Even a slight warming disrupts how tightly the molecules line up, and birefringence, viscosity, and threshold voltage all shift together as a result.
Displays have been the side fighting to eliminate that sensitivity. As temperature rises, colors drift and response speeds up, so panel design has evolved toward compensating for or suppressing that variation.
The Italian team went the other way. They turned that sensitivity into a signal. They placed a gel — liquid crystal trapped in a polymer network — as the dielectric of a capacitor, and read out the capacitance that changes with temperature.
What stands out is the fabrication method. Alignment set by rubbing, a cell built with 20-micrometer spacers, capillary filling, UV curing. It’s exactly what an LC panel line does every day.
The result: capacitance changes by up to 1% per degree Celsius in air, and the device kept working the same way submerged in water and bent.
What this article will focus on comes next. What determined sensitivity wasn’t how much liquid crystal was loaded, but what phase the liquid crystal was in when it was cured — and surprisingly, the less-ordered phase was more sensitive.
1. What’s the advantage of measuring temperature with liquid crystal?
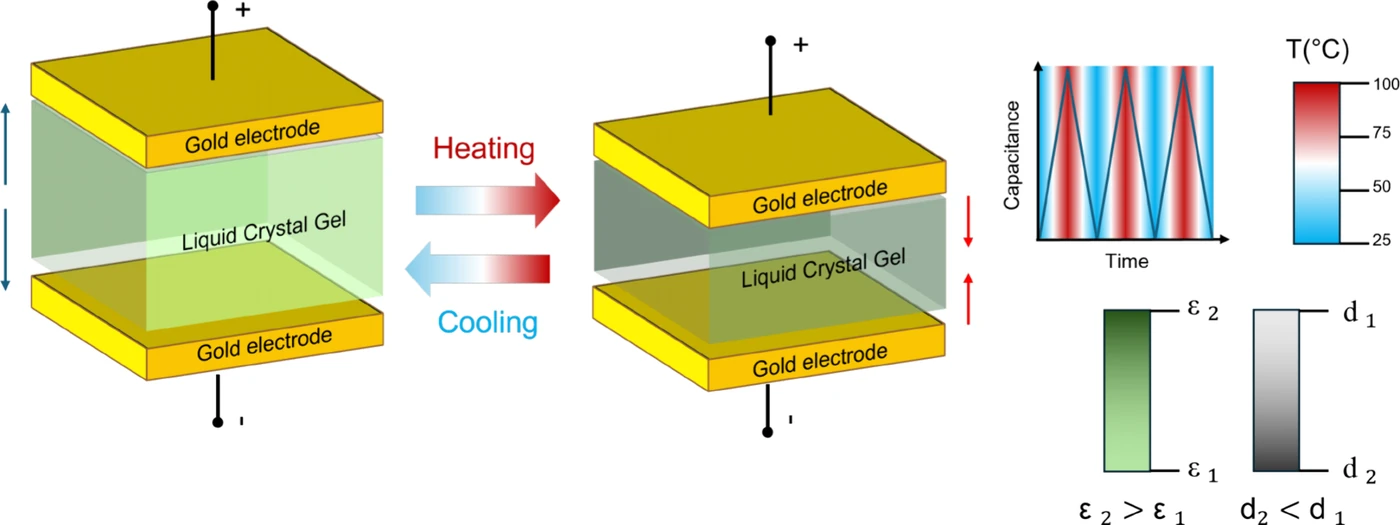
Because the two values that determine capacitance move in the same direction. The capacitance of a parallel-plate capacitor is proportional to permittivity and inversely proportional to the distance between the plates.
When temperature rises, two things happen at once in the liquid-crystal gel. One is that the LC molecules’ alignment loosens, raising the effective permittivity, and the other is that the polymer scaffold contracts, thinning the dielectric.
A higher permittivity increases capacitance, and a thinner dielectric also increases capacitance. The two effects add together. This is what the paper calls a “synergistic dual transduction.”
The problem is that pure liquid crystal is a liquid. It leaks, it’s soft, and it needs a rigid seal. So the team used a gel that traps the liquid crystal inside a cross-linked polymer network — a way to keep the LC’s sensitivity while covering up its mechanical weakness.
2. The process is straight off an LC panel line
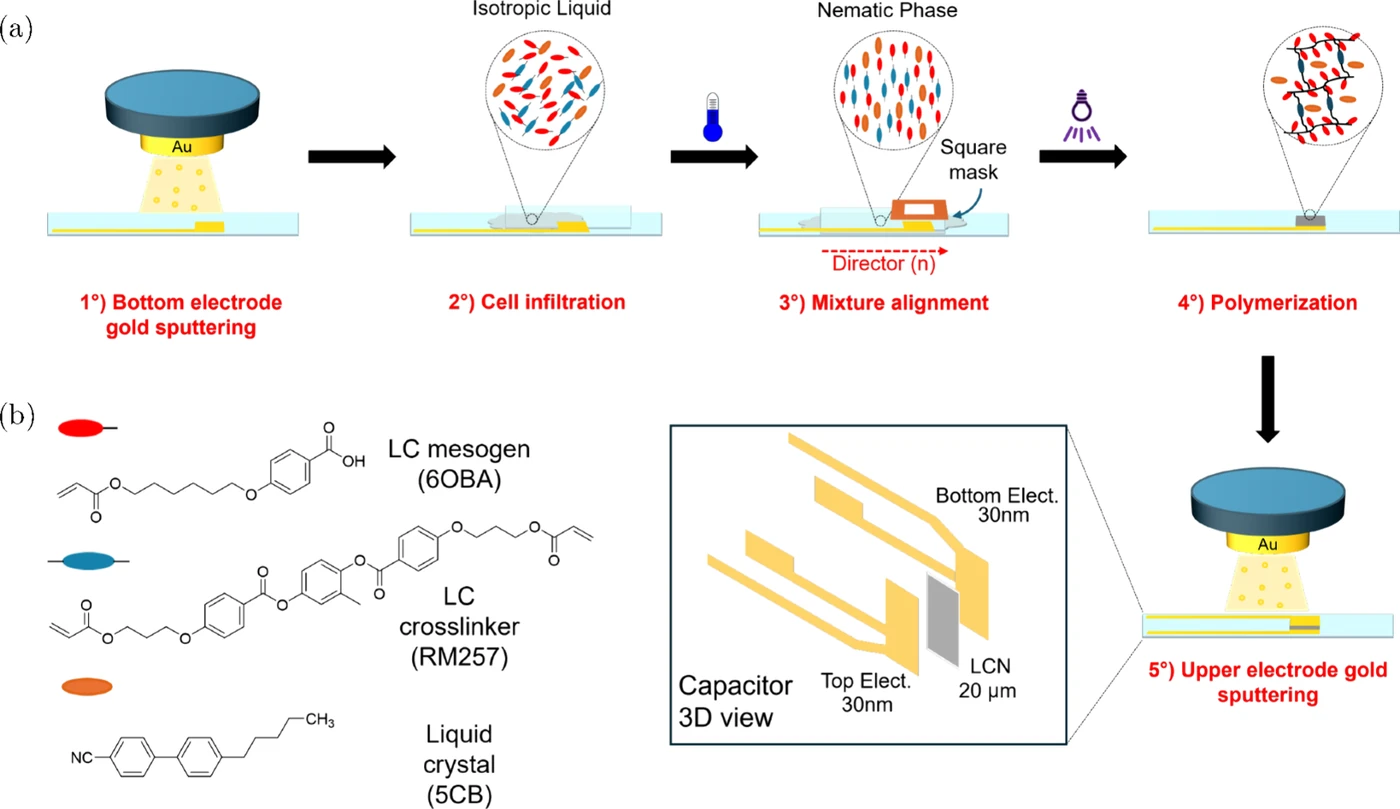
A rubbed alignment layer, a cell gap set by spacers, capillary injection, UV curing. List just the process names and it’s indistinguishable from a day at an LC panel factory.
The sequence goes like this. A 30-nanometer gold electrode is sputtered onto glass or Mylar film. Another glass substrate is coated with polyvinyl alcohol and rubbed to create alignment. This layer doubles as a sacrificial layer that will later be dissolved away in water.
The two substrates are bonded with 20-micrometer spacers to form a cell, and a reactive liquid-crystal mixture is filled in by capillary action. It’s cured with 2 seconds of UV exposure at 55°C, in the nematic phase.
After curing, the device is soaked in water for 24 hours to dissolve the sacrificial layer and lift off the top glass. Gold is sputtered again onto the exposed gel to complete the device. The electrode area is 25 square millimeters, and the measured dielectric thickness is 18 micrometers.
The liquid-crystal materials are familiar too. Two reactive mesogens were mixed 9:1, blended with nematic liquid crystal 5CB at 25, 50, and 75 weight percent.
3. More liquid crystal means more sensitivity — but also more fragility
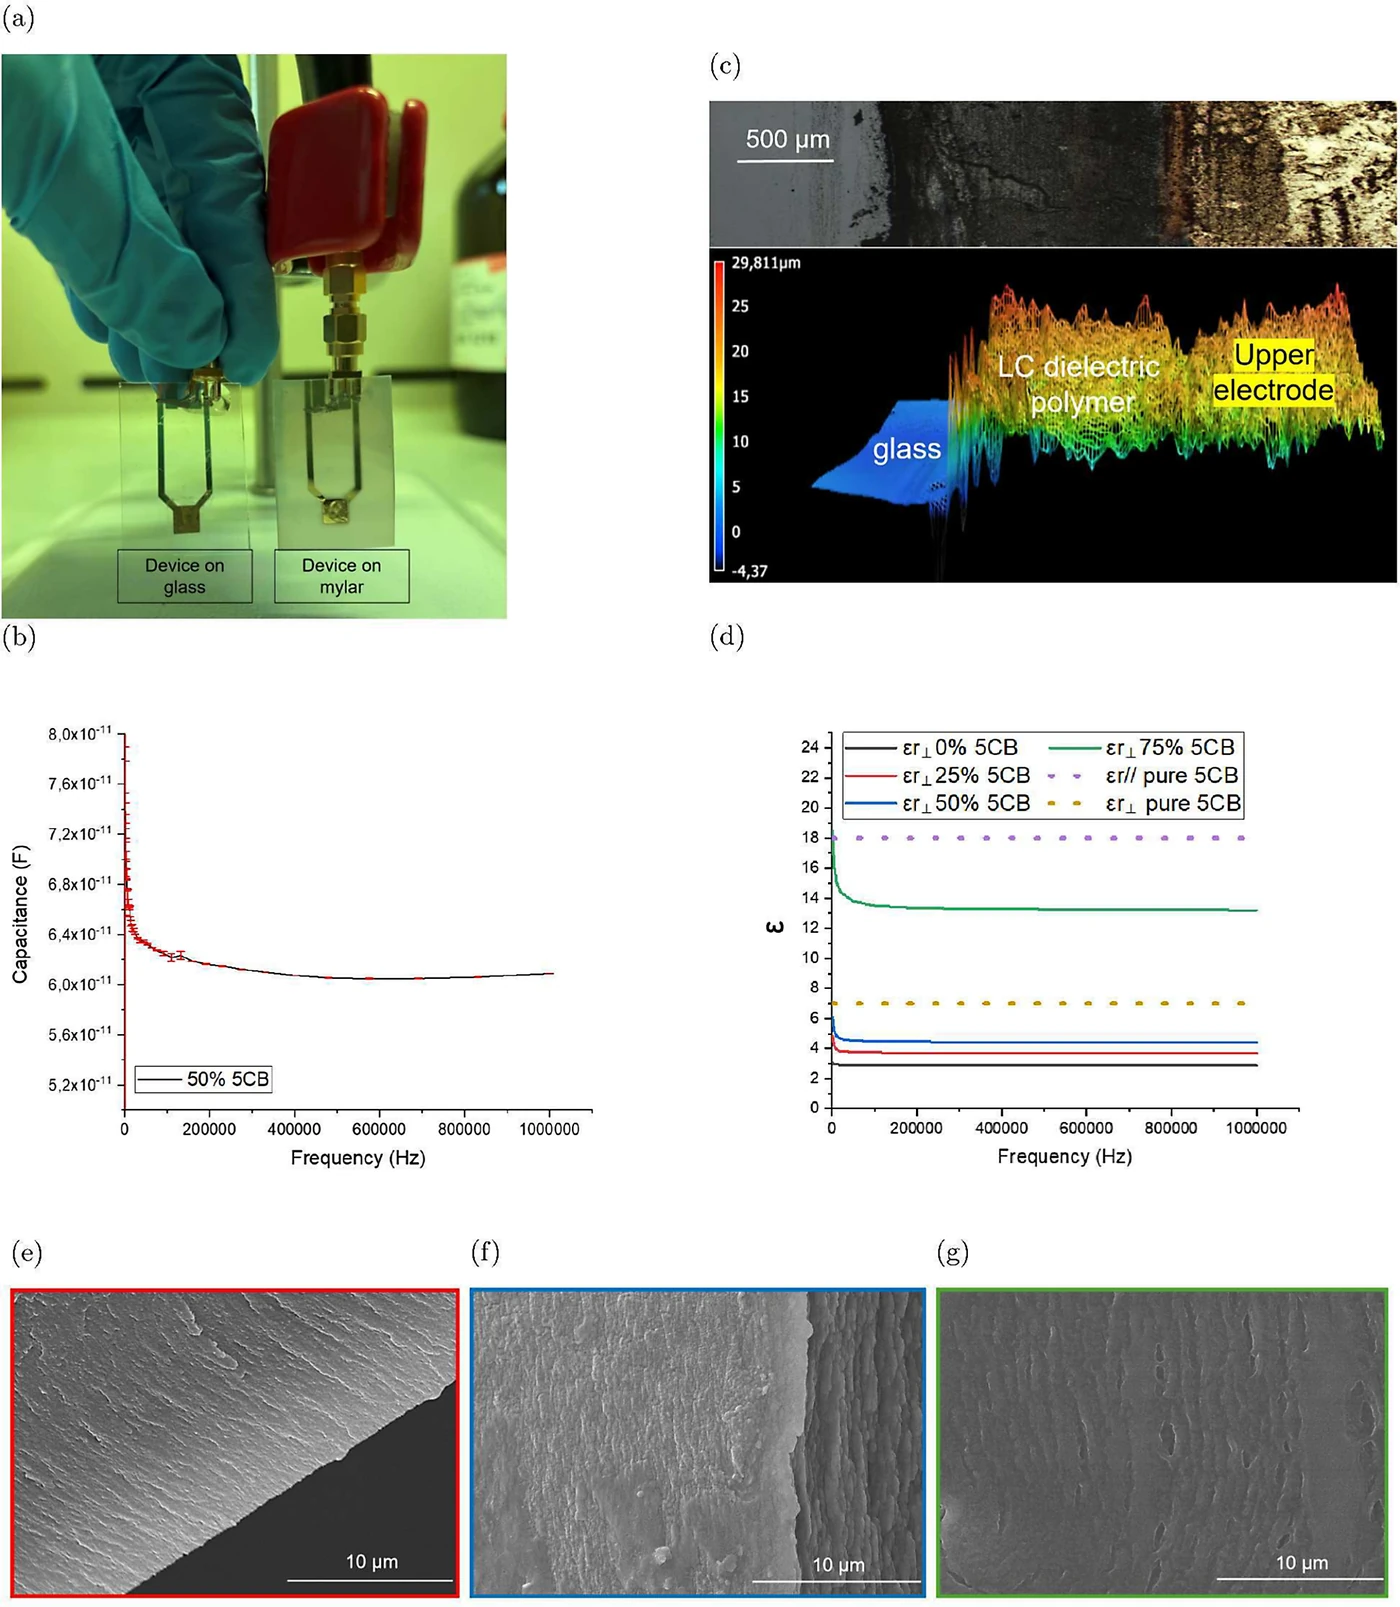
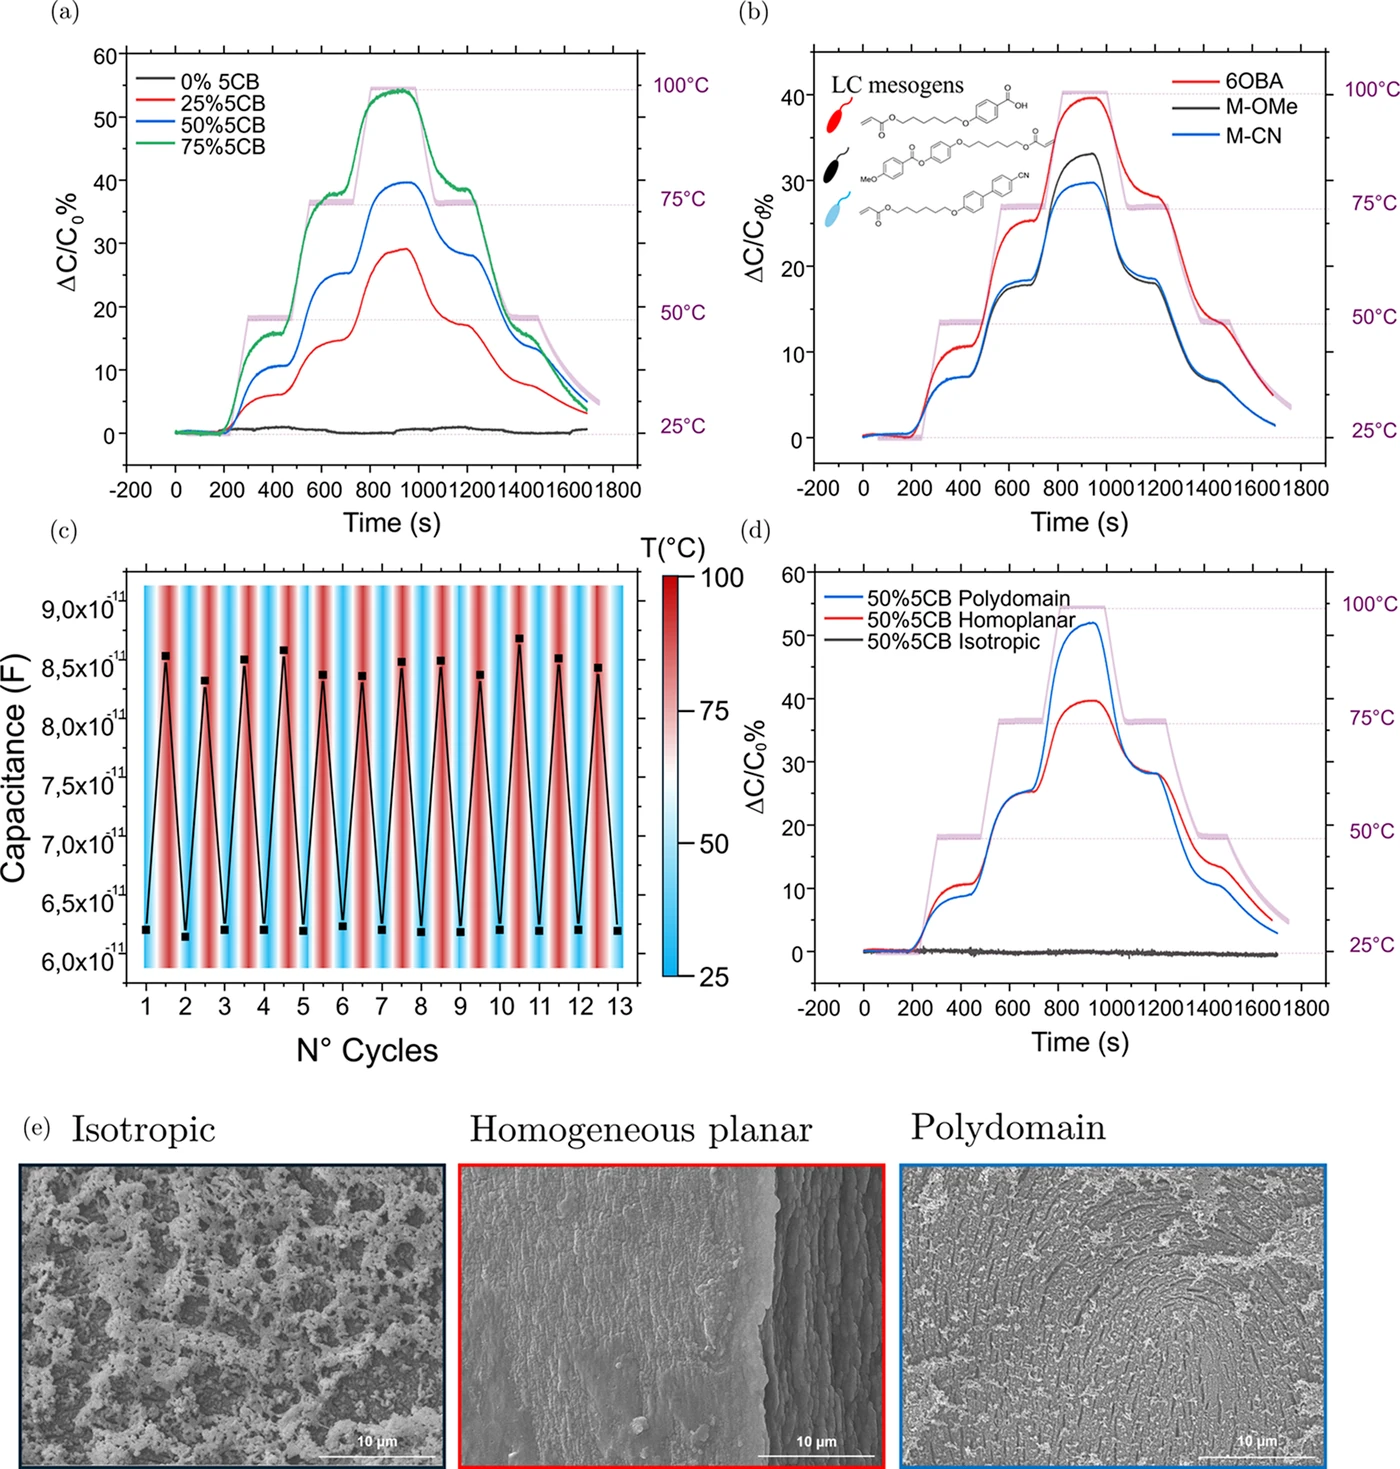
Loading 5CB up to 75% pushes the capacitance change as high as 60%. Going from 25% to 50% only raises permittivity slightly, from 3.7 to 4.4, but at 75% it jumps sharply past 13.
Scanning electron microscopy shows why. At 25–50%, the polymer forms a continuous, gap-free structure, but at 75% it becomes a sparse network riddled with micrometer-scale pores. The liquid crystal filling those pores dominates the permittivity.
But the team chose not 75%, but 50%. The 75% device was too fragile to handle and prone to damage during assembly. It’s a composition that compromises between sensitivity and robustness.
A device with no liquid crystal at all (0%) showed almost no change in capacitance even as temperature rose. This device serves as the baseline. It means the response comes not from the polymer but from the trapped liquid crystal.
4. What actually determined sensitivity
Devices of identical composition cured in the isotropic phase barely responded to temperature at all. The capacitance change was close to zero. This is the clearest divide in the paper.
The team varied only the liquid-crystal state at the moment of polymerization to make three kinds of devices: uniform planar, rubbed to align in one direction; polydomain, left unrubbed and split into multiple domains; and isotropic, cured above the nematic-to-isotropic transition temperature with no alignment at all.
In the isotropic device, the polymer fibers solidified with no direction at all. That means there’s no alignment left to unravel when temperature rises. Even with liquid crystal inside, no response comes out.
One might expect the more ordered device to be more sensitive, but it was the opposite. The uniform planar device topped out at 38%, while the polydomain device produced a change more than 10 percentage points larger.
The paper attributes this to how sparse the network is. The polydomain side has domains standing at odd angles to each other, forming a more open structure, and being less anchored to the substrate makes thermal contraction and realignment easier. This is also the side that shows thickness shrinkage of up to 8%.
Uniform planar is the opposite. Because it solidified aligned in one direction, it’s locked tightly to the substrate, and out-of-plane deformation is suppressed. Being well-aligned works against it here.
5. It kept working submerged in water and bent
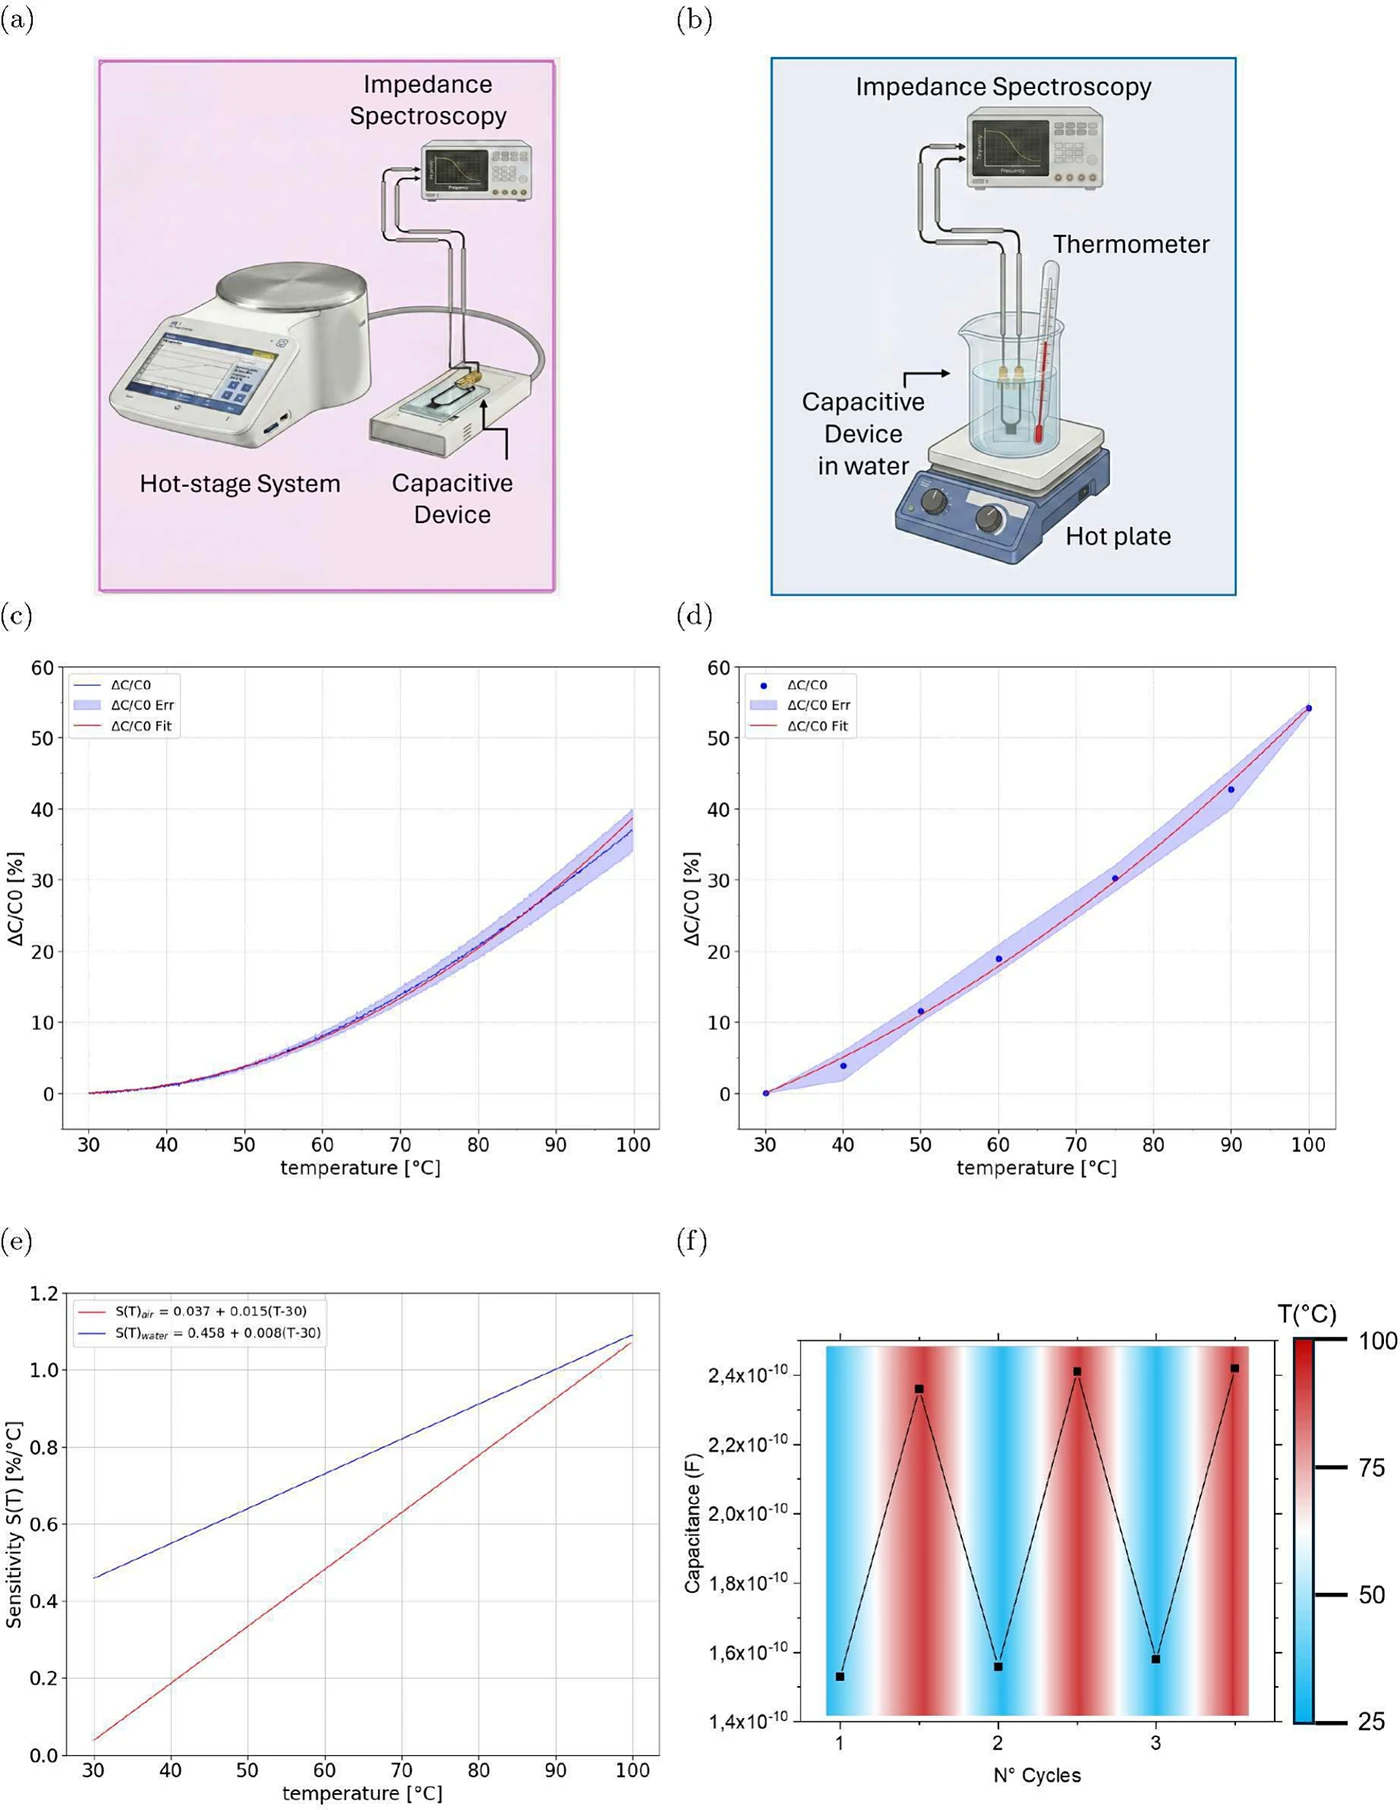
The average sensitivity in water was 0.80% per degree Celsius. The same principle measured in air held up in water too, and the fit quality was good, at 0.9986.
Sensitivity in air varied by temperature range. Near body temperature, at 37°C, it was 0.25%/°C, and above 70°C it was about 1%/°C. The device is most sensitive in the range where the liquid crystal is losing its alignment.
Measuring in water takes one extra step. An electric double layer forms between the electrode and the water, shifting the baseline capacitance, so the baseline has to be recalibrated in water. Readings are taken above 100kHz, where ions can’t keep up.
Repeatability was also confirmed. Cycling between 30°C and 100°C 12 times, the capacitance variation at 100°C was only 3.6 picofarads (4.2%).
The same held on a flexible substrate. Built with the same process on a 125-micrometer Mylar film, it was measured while bent to the degree of a flexing joint and submerged in water.
6. Between the abstract and the body
First, sensitivity isn’t a single number. 0.25%/°C near body temperature and 1%/°C above 70°C are four times apart. The high sensitivity the abstract touts is the value from the high-temperature range where the liquid crystal loses alignment, and the body-temperature range that wearables would use is a quarter of that.
Second, the response isn’t linear. The temperature-capacitance relationship is fit with a second-order polynomial. It can be approximated as linear over a narrow range, and at a ramp rate of 1°C/min it’s recorded as 0.35%/°C.
Third, the underwater numbers are the result of recalibrating the baseline. The electric double layer means the baseline capacitance itself shifts once submerged. The method resets that value and reports only the rate of change, so the absolute values can’t be carried over as-is.
Fourth, thickness shrinkage contributes less than it looks. It’s on the order of 4–5% at 100°C, and the paper writes that the response is driven mainly by the change in permittivity. The two arrows in Figure 1 look the same size, but one contributes far more in practice.
Fifth, this isn’t a display device. What the paper targets is wearables, soft robotics, and underwater sensing. There’s no story here about putting this on a screen.
7. What the display side should take from this
A property display panels have spent years erasing becomes the output here. Alignment losing order with temperature was a nuisance that shook color and response time in a panel. Keep the same physics and just change what you read, and it becomes a sensor.
That’s why the process distance is short, too. Rubbed alignment, cell-gap spacers, capillary filling, UV curing — all of these are basics of an LC line. It’s a structure where how you set alignment, more than new equipment, determines performance, which favors whoever has spent years working that process.
And this paper’s finding puts a value on that very alignment process. With the same material and the same composition, curing in the isotropic phase gives zero sensitivity, while curing in the nematic phase but leaving it less ordered gave higher sensitivity. It means “aligning well” isn’t always the right answer.
The numbers that remain are 0 and 38%. Cure it isotropic and the response is near zero; cure it uniformly aligned and it’s 38%; cure it less uniformly aligned and it’s more than 10 percentage points higher still. That’s the difference obtained without changing the material at all — just by changing the state at the moment of curing.